editor’s note: there are gaps in each graph. i decided to look this up to get some sort of an explanation and found the following. i did find it interesting it was updated late june. i would think if this is not something unusual, an original piece would stand w/o having to need updating. given all of the crazy signatures showing up this summer, perhaps they scramble to come up with something logical-sounding. just putting this out there… the MIMIC is still showing the “Wave X” patterns of energy too.
******
Updated Jun 28, 2018
Overview
This article explains a possible scenario why data is missing from graphs or appear unusual at certain intervals.
Environment
- NPM all versions
Detail
- There are plenty of technical reasons why data is missing from the graph, looking at the Graph Data Point Interval setting by clicking Edit on the graph can help troubleshoot this issue. This setting determines how often a data point is placed on the graph.
- Conflicts or mismatches of this setting with the polling interval of the device that is being monitored affects the graph result. For example, if a node only polls the CPU every 10 minutes and the graph is set to a 1 minute interval, there will not be enough data points to display as the database does not have data for every minute.
- Solarwinds Applications might be experiencing connectivity issues to the Orion DB or DB maintenance not working properly.
******
The following graphs are a 24 hour capture…
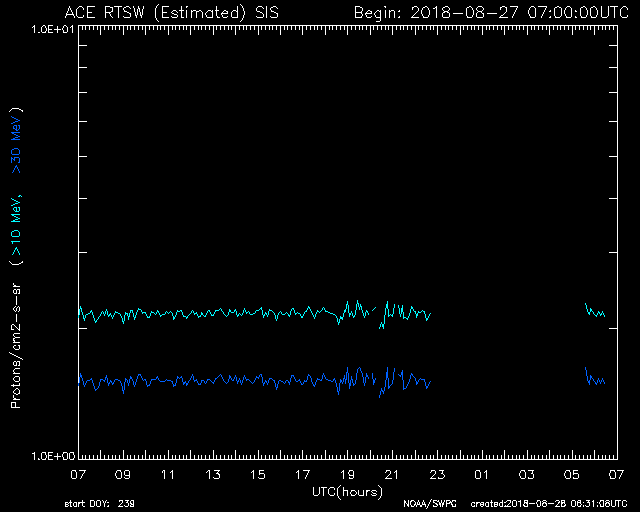
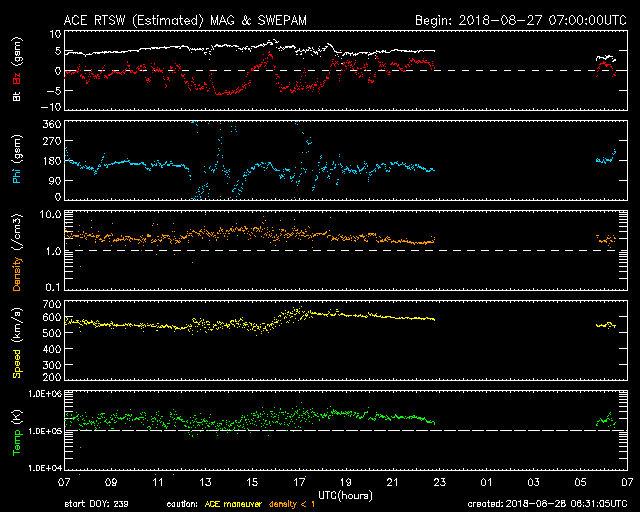
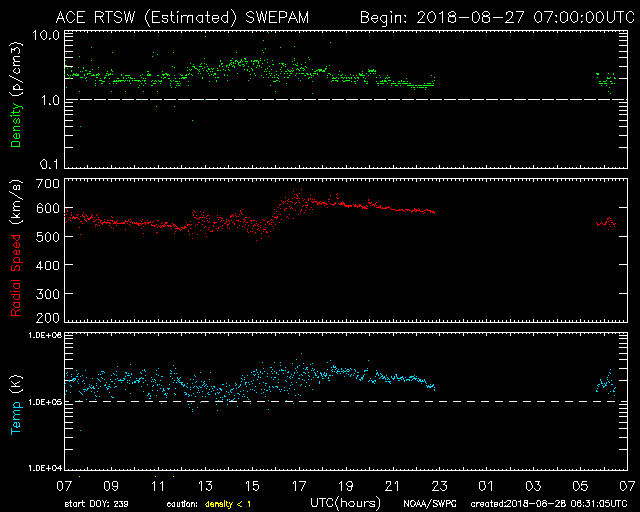
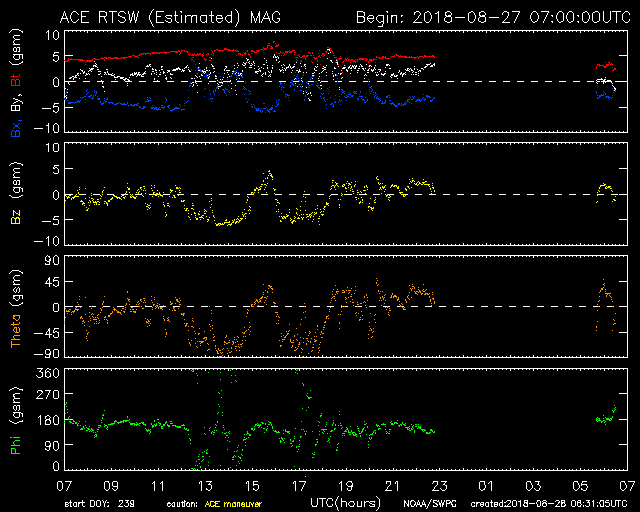
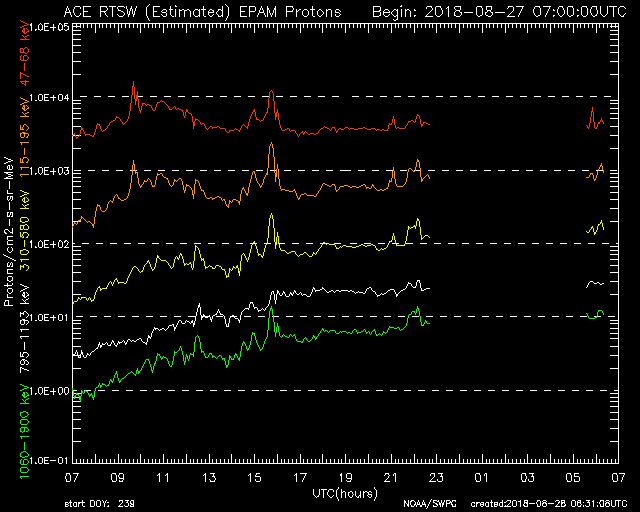
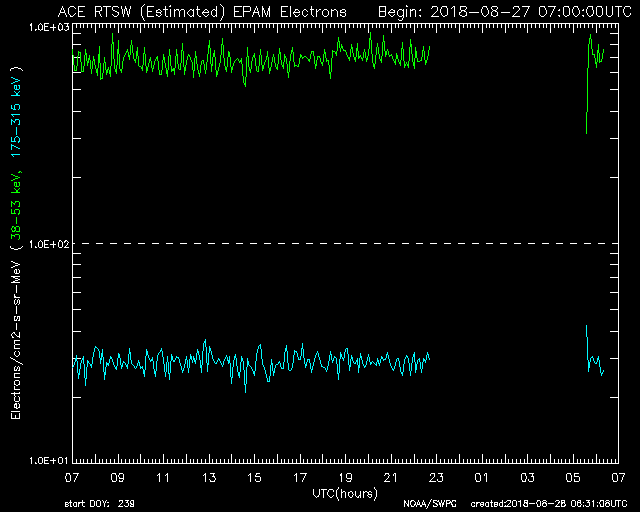
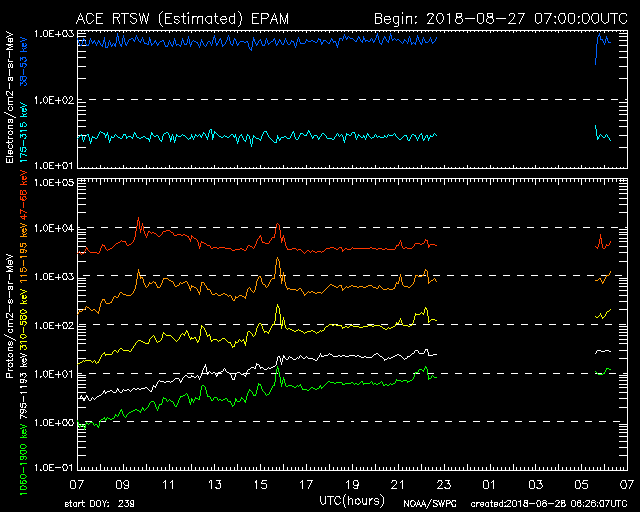
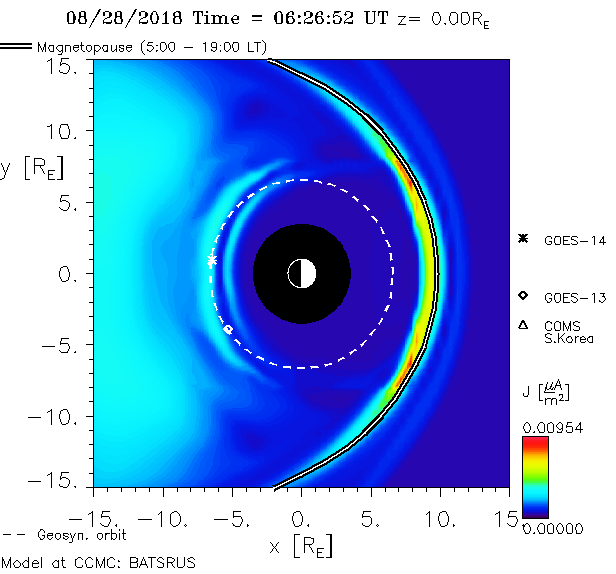
so now i know that pressure behind our realm (the light blue energy fields) is not supposed to be there.
******
Thank you for supporting my work! [wp-svg-icons icon=”heart-2″ wrap=”i”] Please consider donating a few dollars if you like what I do/share.
[wpedon id=”208″ align=”left”]
